Showing posts with label Investment. Show all posts

Thursday, December 12, 2013

Dennis Gartman's 19 Rules Of Trading

2013 was great year for stocks and a crazy year for bonds.
But the amount of money you made depends on how you traded.
Dennis Gartman, editor and publisher of the Gartman Letter, has 19 rules of trading from 2013. But these hold true in general.
Here they are verbatim:

  1. NEVER, EVER, EVER ADD TO A LOSING POSITION: EVER!: Adding to a losing position eventually leads to ruin, remembering Enron, Long Term Capital Management, Nick Leeson and myriad others.
  2. TRADE LIKE A MERCENARY SOLDIER: As traders/investors we are to fight on the winning side of the trade, not on the side of the trade we may believe to be economically correct. We are pragmatists first, foremost and always.
  3. MENTAL CAPITAL TRUMPS REAL CAPITAL: Capital comes in two forms... mental and real... and defending losing positions diminishes one’s finite and measurable real capital and one’s infinite and immeasurable mental capital accordingly and alway.
  4. WE ARE NOT IN THE BUSINESS OF BUYING LOW AND SELLING HIGH: We are in the business of buying high and selling higher, or of selling low and buying lower. Strength begets strength; weakness more weakness.
  5. IN BULL MARKETS ONE MUST TRY ALWAYS TO BE LONG OR NEUTRAL: The corollary, obviously, is that in bear markets one must try always to be short or neutral. There are exceptions, but they are very, very rare.
  6. "MARKETS CAN REMAIN ILLOGICAL FAR LONGER THAN YOU OR I CAN REMAIN SOLVENT:" So said Lord Keynes many years ago and he was... and is... right, for illogic does often reign, despite what the academics would have us believe.
  7. BUY THAT WHICH SHOWS THE GREATEST STRENGTH; SELL THAT WHICH SHOWS THE GREATEST WEAKNESS: Metaphorically, the wettest paper sacks break most easily and the strongest winds carry ships the farthest,fastest.
  8. THINK LIKE A FUNDAMENTALIST; TRADE LIKE A TECHNICIAN: Be bullish... or bearish... only when the technicals and the fundamentals, as you understand them, run in tandem.
  9. TRADING RUNS IN CYCLES; SOME GOOD, MOST BAD: In the “Good Times” even one’s errors are profitable; in the inevitable “Bad Times” even the most well researched trade shall goes awry. This is the nature of trading; accept it and move on.
  10. KEEP YOUR SYSTEMS SIMPLE: Complication breeds confusion; simplicity breeds elegance and profitability.
  11. UNDERSTANDING MASS PSYCHOLOGY IS ALMOST ALWAYS MORE IMPORTANT THAN UNDERSTANDING ECONOMICS: Or more simply put, "When they’re cryin’ you should be buyin’ and when they’re yellin’ you should be sellin’!"
  12. REMEMBER, THERE IS NEVER JUST ONE COCKROACH: The lesson of bad news is that more shall follow... usually hard upon and always with worsening impact.
  13. BE PATIENT WITH WINNING TRADES; BE ENORMOUSLY IMPATIENT WITH LOSERS: Need we really say more?
  14. DO MORE OF THAT WHICH IS WORKING AND LESS OF THAT WHICH IS NOT: This works well in life as well as trading. If there is a “secret” to trading... and to life... this is it.
  15. CLEAN UP AFTER YOURSELF: Need we really say more? Errors only get worse.
  16. SOMEONE’S ALWAYS GOT A BIGGER JUNK YARD DOG: No matter how much “work” we do on a trade, someone knows more and is more prepared than are we... and has more capital!
  17. PAY ATTENTION: The market sends signals more often than not missed and/or disregarded... so pay attention!
  18. WHEN THE FACTS CHANGE, CHANGE! Lord Keynes... again... once said that “ When the facts change, I change; what do you do, Sir?” When the technicals or the fundamentals of a position change, change your position, or at least reduced your exposure and perhaps exit entirely.
  19. ALL RULES ARE MEANT TO BE BROKEN: But they are to be broken only rarely and true genius comes with knowing when, where and why!
(C) MAMTA BADKAR

Monday, December 9, 2013

The Bouncing Zone Strategy — Part 1

Introduction

Your are about to read the part 1 of a 3 part article called "the bouncing zone strategy".
You should know that I haven't invented this strategy. I've learned it on the internet and with friends, and then tweaked it to feet my needs. Some people call this strategy "supply and demand levels", but I think "bouncing zones" better describe what it's about.

The setup

This is a strategy based on Price Action, so the setup is quite simple: just the price in candle sticks. No indicator at all. I trade mostly on the main pairs (EUR/USD, GBP/USD, etc.), and on a 1h timeframe (TF). But this technique should work on any pair and any TF.

The basic idea

Sometimes we see price moving very rapidly in one direction. What does it mean? Let's use an example to make things simple:
  • Some people are selling a huge amount of $currency, and these "some people" are usually big banks
  • That makes the price drop quickly from 1.3 to 1.2
  • It means that a lot of people who wanted to sell $currency at around 1.3 couldn't do so, since price moved so fast
  • So next time the price goes back around 1.3, a lot of sell orders are going to be triggered, and price is going to move down again
  • Of course it works the opposite if price increased from 1.2 to 1.3
Once you realise that, you just have to use this information at your advantage. Here's a EUR/USD chart that shows this.

Legend:
  • 1) Price dropped quickly from here, we call this a zone
  • 2) Then when the price reaches back the same zone, the price bounce
Now you should understand why we call this strategy "bouncing zones". The zones from where price move quickly in one direction are called:
  • Demand zone, when people want to buy and price will increase
  • Supply zone, when people want to sell and price will go down (like in the example chart above)
So you just have to identify these supply and demand zones, place orders when the price goes back into these zones, and wait for the price to bounce. Obviously not all zones are going to work as planned. But from my experience, enough are going to work in our favor to make this system work, and make money.

How to identify bouncing zones

Identifying zones is quite easy. All it takes is two steps:
  • 1) On a chart, identify all strong price movement
  • 2) Find the base of the price movement, where the price moves slowly in sideways. This is what we call a zone.
In the example below we see 3 strong price movement. There is a supply zone that already worked, and a new demand zone.

You can see that it's quite easy to do!

How to precisely draw zones

This part is hard to explain precisely, cause there may be some rules to follow, but your also need some kind of instinct, that you can only learn by doing. Drawing zones is an "art". Anyway, the basic idea is this:
  • Look at the base of a strong price movement to find some candles moving sideways
  • Make the zone cover all of these candles (body and shadows)
  • Then refine your zone:
    • If it's a supply zone, you do not care about the lower shadows of the candles
    • If it's a demand zone, you do not care about the upper shadows of the candles
Here are a few examples of zone drawing:

Legend:
  • In blue + orange: the whole zone that covers all the candles
  • In orange: the shadows we're not interested in, as explained above
  • In blue: the refined zone to use for the trade

Entry, stop loss and take profit

Once you identify a zone that you want to trade, you have to set up the trade. Here's how I do it with a little example.

Legend:
  • Blue rectangle: the supply zone
  • Blue line: the entry of the trade, at the beginning of the zone
  • Red line: the stop loss (SL), usually 2-3 pipes above the end of the zone
  • Green line: the take profit (TP), that is simply placed in a way to have a 1:2 or 1:3 risk:reward ratio (in this example it's a 1:3)
So once you know how to draw zones, setting up trades is really simple with these rules.

Examples of bouncing zones

Below are 4 examples of bouncing zones from CHF/JPY charts. Two are demand zones (top), and two are supply zones (bottom).

You should try to find zones on your own charts, and see the price bouncing into them

Credit: 21pips

Friday, November 22, 2013

How to Trade Forex with Ichimoku: The 3 Major Lines

Screen shot 2013-03-18 at 7.33.13 AM

I think the best way to describe ichimoku is that its a trend following indicator that gives you a graphical picture of where the support and resistance lines are. Contrary to most trading system, support and resistance lines are not a straight line in ichimoku. They vary depending where the price is going.
The benefit of this kind of thinking that support and resistance lines are not flat lines is that, it prepares us to expect nothing of a breakout because that breakout point may disappear since the support and resistance lines in ichimoku is not a flat line.
The 3 major lines in ichimoku and sometimes called the ABC lines are:
  • Tenkan Sen Line (dark blue)
  • Kijun Sen Line (red)
  • Chikou Span (teal)
Referring to our old diagram:

Screen shot 2013-03-18 at 7.33.13 AMTenkan Sen

The tenkan sen line can be thought of as a light resistance. A trend may hit the tenkan sen lines a couple of times and break. It can also serve as an entry point for traders who wants to get in on the trend after a small retrace.

Direction

The tenkan sen can also be an indicator of trend direction, when the price is trending, or it is about to trend, the tenkan sen will point to the direction of the coming trend or prevailing trend. In other words, it points up if it wants to trend up and down if it wants to trend down. If flat, there’s a consolidation and the trend may reverse. Keep in mind that I said earlier that the tenkan sen is a light resistance. And it is true for the trend it indicates. The trend may be weak when indicated by tenkan sen. It is the short term indication of the trend and the light weight of support and resistance.

Kijun Sen

When Tenkan sen is the lightweight, kijun sen is the heavyweight. When price reaches for the kijun sen, its a strong support and resistance. And breaking the kijun sen will result in a reversal of the trend most of the times. A false break out of the kijun sen will result in a strong continuation of the trend.
The proper use of kijun sen is for entry. When price reaches for the kijun sen, its a good probability to add position or enter the trade. That is, if you’re a trend follower. For the contrarian, its a good position to bet on the other side of the trend.

Direction

The Kijun sen also points up, down and flat. Same thing as the tenkan sen lines. But keep in mind that the kijun sen is a heavy weight and the indication is that the trend will continue for med to long term.

Chikou Span

There are many description to define Chikou. Some traders I know ignore it altogether. But I think, Chikou is very important. It is the momentum of the trend.
The chikou also gives you the direction of the trend. When it points up, down and flat is the same with the kijun and tenkan sen lines. What’s unique about chikou is that it gives you another indication. Where it is placed on the chart has an impact.
When the chikou collides with the price action candle stick, it means, its consolidating.
When the chikou is below a price action candle stick, it means its bearish.
When chikou is above price action, its bullish.
When its inside a cloud (we will explain cloud in later posts), it is consolidating.
And when the chikou is free to roam, no cloud, no price action to collide with, then the trend is strong, and will probably last for a very very very long time.
The key to using these lines is to look at them all and how they behave. On the next post, we will discuss how all these 3 lines act together to give you a well informed representation of a good probability trade.
(c) ForexPhilippines

Thursday, November 21, 2013

How to Trade Forex with Ichimoku: Introduction

ichimoku
Ichimoku Kinko Hyo or Ichimoku for short, is a trend following indicator that has been created by a Japanese named Goichi Hosoda. He made a book about the indicator in 1968. But since the lack of translation to other languages, very few traders knew of its existence and for a long time, it has been treated as one of those “exotic” indicators that never really given the time to shine. Just until recently that this indicator proved to be very powerful.

Why Use Ichimoku?

Ichimoku has been used extensively to trade forex / currencies, commodities, futures and stocks. In other words, it can trade any market with no problem.
The word Ichimoku Kinko Hyo means “Equilibrium chart at a glance”, where the components of ichimoku works with each other that gives the trader a visual representation of the price action. A simple look at the chart with the ichimoku indicator will allow the trader to have an immediate understanding of sentiment, momentum and strength of trend.

5 Basic Components of Ichimoku

The ichimoku indicator has 5 basic components. A trader must know very well what each of these components do to maximize the power of this indicator. Each component is an indicator of its own and a lot of traders turn off the other components for preference. But if you really want to maximize its potential, I recommend to get to know each component and use all of them.
ichimoku
  1. Tenkan Sen which means “Turning Line” takes 9 periods
  2. Kijun Sen which means “Standard Line” takes 26 periods
  3. Chikou Span which means “Lagging Line” takes 26 periods but time-shifted backwards.
  4. Senkou Span A, first leading line, time-shifted forwards (into the future) 26 periods.
  5. Senkou Span B, second leading line, for the past 52 periods time-shifted forwards (into the future) 26 periods.
I know what you’re thinking. You’re probably thinking this doesn’t make much sense. And I agree with you. The first time I knew about these periods and time shifting thing, I got confused. But trust me for now and it will all be clear later.
We need to memorize the periods so that when you get into a trading platform, you’ll be able to set your ichimoku indicator to default values.
That’s all for now, for the next lesson, we’ll go through each one of this components. If you have any questions, please feel free to comment below.
(C) ForexPhilippines

MetisEtrade Internship Program

MetisEtrade, Inc. is a Financial Services company in the Philippines specialized in providing traders with high-quality online trading and investment advisory services. We are backed by a team of dedicated specialists partnering with financial institutions around the world. For those who are interested in developing a career in investment and financial service industry and becoming the most successful professional in Philippines, this will be the ideal introduction for you as you will be exposed to the different aspects of front office tasks that will test your existing and potential skills in sales, trading and market research.

What you get:

• Competitive daily allowance up to 1000 Peso

• Fulltime job offer as a management trainee for qualified candidates

• Intense training on market research and analysis

What you do:

• You will be assisting traders and analysts in preparing initial market research on currencies around the world.

• You will learn how different economic indicators will affect market psychology and cause price fluctuations.

• You will learn various quantitative trading methods and advanced trading strategies to identify new trading mechanism in Foreign Currency Market

• You will assist the sales team in consulting clients, promoting the company’s products and services, and developing the current marketing strategies of MetisEtrade.

• You will have the chance to expand your network and build your contacts. 

Who we want

• We simply want to the best

• We’re looking for team players and future leaders with exceptional drive, creativity and interpersonal skills. 

• Although an impressive academic background is important, activities outside the classroom will also be assessed

• Ability to communicate in another language (Chinese, Japanese, and Korean) will be advantageous.

• This internship is offered only to graduating senior.

Start Your Application!

Submit an online application to maureen.l@metisetrade.com Successful applicants will be called for an initial phone interview followed by a 1 hour final assessment at 9th floor Marajo Tower, 26th Street cor. 4th Ave., Fort Bonifacio Global City, Taguig 1634

Wednesday, November 20, 2013

How to predict the market’s next moves

MIAMI, Fla. (MarketWatch) — If you ask many traders which market indicator they’d use if they could only choose one, it would be moving averages.
Even if you don’t believe in technical analysis, take a look at moving averages, a powerful but simple indicator that gives important clues to market direction. The most popular are the 50-day, 100-day, and 200-day moving averages, although people use the 200-day measure as a guide to the long-term market trend.
But in a recent article, MarketWatch columnist Mark Hulbert found that a portfolio following the 200-day moving average hadn't produced such impressive results over the past 20 years. “Even on a risk-adjusted basis over the last two decades, the 200-day moving average has lagged a simple buy-and-hold approach"
If you’re a buy-and-hold investor, you’re probably not interested in timing strategies, and as Hulbert concludes, the 200-day moving average may not be the ideal vehicle for timing the market. If you’re a trader, however, you can use moving averages for timing. More important, moving averages can help provide clues to market direction.
Short-term traders tend not to use the 200-day MA for timing, but prefer the 13-day, 20 or 21-day, or 50-day. For example, long-term trader Laszlo Birinyi, president of Birinyi Associates, makes his trades based in part on a stock’s 50-day moving average.
Other traders use even shorter time frames such as the 8-day or 10-day moving average. They use it both for support and resistance, and also observe when one moving average crosses another. One popular crossover strategy: when the 8-day MA (the shorter moving average) crosses above the 13-day MA (the longer moving average), this is a signal to buy. Conversely, if the 8-day crosses below the 13-day MA, this could be a signal to sell.

Using moving averages for support and resistance

Traders, and investors, also use moving averages for support and resistance. For example, in June the S&P 500 sliced through the 50-day and 100-day moving averages. If the benchmark were to drop below its 200-day moving average, this would be a major sell signal.
Why? Because the 200-day moving average, and other moving averages, act as support (which is like a floor), or resistance (which is like a ceiling). It takes a lot of buying or selling pressure to move the market above or below a moving average.
Yet moving averages are not perfect. First, they are considered lagging indicators, which means they follow prices. In other words, they are often slow to react to market conditions. By the time the index drops below the moving average, you may already be out of luck. In addition, moving averages are not ideal during choppy trading environments. Like any indicator, you never want to make trades based solely on its results without confirming with other indicators.

Moving averages for rookie traders

If you are a rookie trader and want to know more about moving averages, here’s a brief tutorial.
Moving averages show the value of a security’s price over a period of time, such as the last 10, 20, 50, 100, or 200 days. Most people overlay the stock price over its moving average on a chart to get a good feel where the stock or market is headed.
Calculating a moving average is not difficult. For example, the 20-day simple moving average is found by taking an average of the last 20 days of the market’s closing price and dividing by 20. So as the 21st day is added, the first day is dropped off. It’s constantly moving, which is why it’s called a moving average. In addition to the simple moving average, many people use the exponential moving average, which gives more weight to the most recent time periods.
Many traders have designed strategies based on moving averages. With the help of a professional technician, last year I back-tested dozens of trading strategies. What did I find? The moving average crossover strategy (buy when the 50-day crosses over the 200-day, and sell when the 50-day crosses below the 200-day) consistently ranks high, especially when the market is trending.
The advantage of using moving averages is that it helps keep your emotions out of the trade.
Bottom line: If you are an investor or trader, you can gain valuable information by watching how stocks or indexes react when they rise above, or below, their moving averages.
Credit: Michael Sincere is the author of Start Day Trading Now (Adams Media, 2011), All About Market Indicators (McGraw-Hill, 2010), and Understanding Stocks (McGraw-Hill, 2003).

Thursday, September 19, 2013

7 Things You Need to Do With Your Money Right Now !

If you're like most entrepreneurs, chances are you're balancing your time between managing your team, making sales, improving customer service, marketing your business and creating new products or services. The last thing you want to do is add managing your personal finances into the mix. But if you don't have your own financial house in order, you're only adding to the chaos and stress in your life --whether you're aware of it or not.
Here are seven ways to make sure your financial house is in order as you continue to expand your business:
1. Get educated.
Take the time to educate yourself about various personal finance topics. Schedule weekly money dates with yourself and spend a few hours managing your personal finances and reading financial books, blogs or magazines. The more you know about your own finances, the more confident you will feel about managing your money for the long haul. If you need even more support, consider hiring a certified financial planner who can help you understand your money and create a financial plan to help you reach your goals.
2. Check your credit regularly.
Your credit report is like a file on you and your credit history. It basically tells lenders how risky a borrower you are. When it comes time to purchase a new home or new car, you want your credit report and credit score to be in top financial shape so you qualify for good interest rates. Get in the habit of checking your credit report and credit score at least annually to confirm its accuracy. Do it on your birthday to make keeping track easy. You can access your credit report for free once per year at www.annualcreditreport.com, then pay an additional fee to get your credit score.
3. Create a budget.
Although this sounds very basic, many entrepreneurs have no budget in place to track their monthly personal income and expenses. You can use online systems like mint.com to track your income and expenses, or simply an Excel spreadsheet. Whatever budgeting system you decide to use, just make sure it works for you and your lifestyle. If you're serious about cleaning up your finances and getting ahead financially, you must allocate time and energy to updating your budget every week. This will ensure you're not spending more than you earn and that you're able to save for your financial goals.
4. Automate your finances.
Technology makes it super easy to manage day-to-day finances. Set up your finances so that a majority of the process is automated. You can use online bill pay or set up automatic transfers every month for your bills. That way you don't have to worry about whether you're paying your bills on time or being charged late fees for late payments. If you're concerned about having all your bills automated, set up corresponding calendar alerts to check your statements and payments to ensure accuracy. Also, strive to automate your savings every month. The more you can automate your finances, the less you have to worry about on a day-to-day basis.
5. Pay off debts.
Make a plan to pay off your personal debts as soon as possible. Start by making a list of all your debts -- car loans, credit cards, student loans, etc. Include the current balance, minimum monthly payment and interest rate. Then review your budget to determine how much money you can add toward additional debt payments. From there, you can do some more research on the best debt-reduction strategy to confirm you're paying off your debts in the most efficient and effective manner. When working on debt reduction, it is important that you have an adequate cash cushion or money in the bank for any short-term emergencies that may arise.
6. Build your own cash cushion.
Having a cash cushion is an integral part of your financial foundation. It allows you to use cash to pay for those random expenses or emergencies that arise in your day-to-day life instead of creating more debt or tapping into long-term investments. As an entrepreneur, you should strive to have a cash cushion of six to 12 months of your committed expenses. A cash cushion will allow you to pay for your personal bills and not worry about making ends meet if you need to reduce your income due to tight business cash flow.
7. Start investing outside your business.
While it is very important to always invest in yourself and your business, you don't want to have all your eggs in one basket. Diversification is extremely important, as it will help spread out your investment risk over the long haul. Work with a financial planner to create a long-term investment portfolio of stocks, bonds and real estate that is aligned with your financial goals and risk tolerance.
Credit: Brittney Castro

Monday, September 16, 2013

How to Stay Consistently Profitable in a Random Market Environment

Have you ever wondered how casinos actually work and make money consistently?
Casinos rake in a ton of dough every single day, despite the fact that casino operators cannot predict with certainty which person will be a total noob and split 5s against a dealer showing a 10, or who will hit the jackpot playing slot machines.
How is this possible? Shouldn't random outcomes lead to inconsistent profits?
Casinos are able to consistently generate profits because they understand that, for each game, the casino has an EDGE over the players. They understand that over time, probable outcomes can actually produce consistent and predictable results, given that the sample size is large enough.
Just like a casino, traders are in the business of trying to be consistent and making money in a seemingly random work environment. The key is to think in terms of probabilities.
This is actually much easier said than done because it requires two layers of belief that you would initially think cannot coexist.
The first level is on the micro, trade-specific level.
At this stage, you have to understand and accept the uncertainty and unpredictability of each trade.
Forex Trader
Let's go back to our casino example and use everyone's favorite game, blackjack. While playing blackjack, you never know what cards you'll be dealt nor do you know how each player will play his or her own hand. These factors have a direct effect on the outcome of your hand.
And yet, there are some who make money playing blackjack because they understand that each hand is STATISTICALLY INDEPENDENT of every other hand and that over time, if they follow basic strategy, they can decrease the house edge and actually generate a small profit.
The same is true for trading. We have to understand that each trade is independent of every other trade. Whether you won or lost the previous 10 trades has no bearing on the outcome of your next trade. Once you accept this, you can easily take trades without being adversely affected.
The second layer of belief is on the macro, bigger picture level.
You have to understand that, over time and with a large enough sample size, the probability of profit or loss is relatively certain and predictable. This degree of certainty is based on the constant variables that are known in advance and most importantly, within YOUR CONTROL.
Once you recognize the independence of each trade and believe in letting good odds play themselves out, then you'll have an easier time at removing emotions from your trades.
For example, you're less likely to exit a trade early if you know that your trade idea has a good probability of winning in the first place. Similarly, you're less likely to fuss over the outcome of each trade if you know that given enough sample size, your trading method will most likely work out in your favor.
But before you place too much confidence in your trading method, you must first make sure that it has an EDGE over the markets. I have written a lot of articles about having an edge because IT'S THAT IMPORTANT. Without an edge, you are just like any random fool who walks into a casino - yeah, you might win once in a while, but over time, the casino will win because they have the edge over you.
The key to having an edge isn't found in paying bajillions of dollars for a "risk-free system" that can "guarantee profits." In my hundreds of years of trading, I have found that the best traders find their edge by constantly looking for opportunities and tirelessly putting in the muscle work needed to fine tune their trading styles and methods.
The bottom line is that consistently profitable traders don't just rely on luck - they rely on the knowledge that their system works because they have put in the necessary efforts to make it work.

Credit: Pipsychology

Saturday, September 14, 2013

Proof that War Is Bad for the Economy !

Top Economists Say War Is Bad for the Economy

Preface: Many Americans – including influential economists and  talking heads - assume that war is good for the economy. Many congressmen assume that cutting pork-barrel military spending would hurt their constituents’ jobs.  As demonstrated below, it isn’t true.
 Nobel-prize winning economist Joseph Stiglitz says that war is bad for the economy:
Stiglitz wrote in 2003:
War is widely thought to be linked to economic good times. The second world war is often said to have brought the world out of depression, and war has since enhanced its reputation as a spur to economic growth. Some even suggest that capitalism needs wars, that without them, recession would always lurk on the horizon.
Today, we know that this is nonsense. The 1990s boom showed that peace is economically far better than war. The Gulf war of 1991 demonstrated that wars can actually be bad for an economy.
Stiglitz has also said that this decade’s Iraq war has been very bad for the economy. Seethisthis and this.
Former Federal Reserve chairman Alan Greenspan also said in that war is bad for the economy.
And he made this point again in 1999:
Societies need to buy as much military insurance as they need, but to spend more than that is to squander money that could go toward improving the productivity of the economy as a whole: with more efficient transportation systems, a better educated citizenry, and so on.
This is the point that retiring Rep. Barney Frank (D-Mass.) learned back in 1999 in a House Banking Committee hearing with then-Federal Reserve Chairman Alan Greenspan. Frank asked what factors were producing our then-strong economic performance. On Greenspan’s list: “The freeing up of resources previously employed to produce military products that was brought about by the end of the Cold War.” Are you saying, Frank asked, “that dollar for dollar, military products are there as insurance … and to the extent you could put those dollars into other areas, maybe education and job trainings, maybe into transportation … that is going to have a good economic effect?” Greenspanagreed.
And economist Dean Baker notes:
It is often believed that wars and military spending increases are good for the economy. In fact, most economic models show that military spending diverts resources from productive uses, such as consumption and investment, and ultimately slows economic growth and reduces employment.

War Spending Diverts Stimulus Away from the Real Civilian Economy

The New Republic noted in 2009:
Conservative Harvard economist Robert Barro has argued that increased military spending during WWII actually depressed other parts of the economy.
(New Republic also points out that conservative economist Robert Higgs and liberal economists Larry Summers and Brad Delong have all shown that any stimulation to the economy from World War II has been greatly exaggerated.)
How could war actually hurt the economy, when so many say that it stimulates the economy?
Because of what economists call the “broken window fallacy”.
Specifically, if a window in a store is broken, it means that the window-maker gets paid to make a new window, and he, in turn, has money to pay others.  However, economists long ago showed that – if the window hadn’t been broken – the shop-owner would have spent that money on other things, such as food, clothing, health care, consumer electronics or recreation, which would have helped the economy as much or more.  If the shop-owner hadn’t had to replace his window, he might have taken his family out to dinner, which would have circulated more money to the restaurant, and from there to other sectors of the economy.   Similarly, the money spent on the war effort is money that cannot be spent on other sectors of the economy.
Indeed, all of the military spending has just created military jobs, at the expense of the civilian economy.
As Austrian economist Ludwig Von Mises pointed out:
That is the essence of so-called war prosperity; it enriches some by what it takes from others. It is not rising wealth but a shifting of wealth and income.
noted in 2010:
You know about America’s unemployment problem. You may have even heard that the U.S. may very well have suffered a permanent destruction of jobs.
But did you know that the defense employment sector is booming?
As I pointed out in August, public sector spending – and mainly defense spending – has accounted for virtually all of the new job creation in the past 10 years:
The U.S. has largely been financing job creation for ten years. Specifically, as the chief economist for BusinessWeek, Michael Mandel, points out, public spending has accounted for virtually all new job creation in the past 1o years:
Private sector job growth was almost non-existent over the past ten years. Take a look at this horrifying chart:
longjobs1 The Military Industrial Complex is Ruining the Economy
Between May 1999 and May 2009, employment in the private sector sector only rose by 1.1%, by far the lowest 10-year increase in the post-depression period.
It’s impossible to overstate how bad this is. Basically speaking, the private sector job machine has almost completely stalled over the past ten years. Take a look at this chart:
longjobs2 The Military Industrial Complex is Ruining the Economy
Over the past 10 years, the private sector has generated roughly 1.1 million additional jobs, or about 100K per year. The public sector created about 2.4 million jobs.
But even that gives the private sector too much credit. Remember that the private sector includes health care, social assistance, and education, all areas which receive a lot of government support.
***
Most of the industries which had positive job growth over the past ten years were in the HealthEdGov sector. In fact, financial job growth was nearly nonexistent once we take out the health insurers.
Let me finish with a final chart.
longjobs4 The Military Industrial Complex is Ruining the Economy
Without a decade of growing government support from rising health and education spending and soaring budget deficits, the labor market would have been flat on its back. [120]


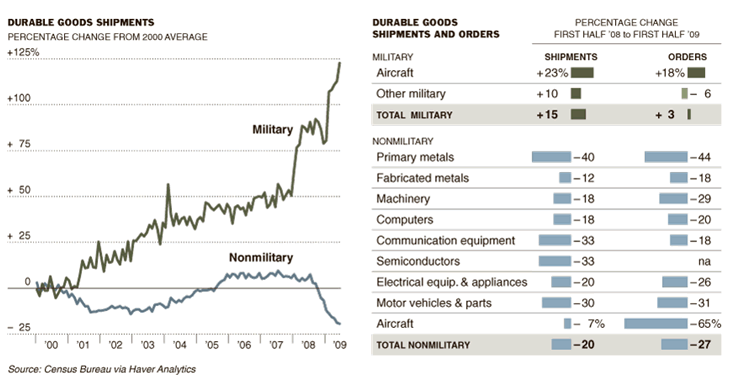
The use of the military-industrial complex as a quick, if dubious, way of jump-starting the economy is nothing new, but what is amazing is the divergence between the military economy and the civilian economy, as shown by this New York Times chart.
In the past nine years, non-industrial production in the US has declined by some 19 percent. It took about four years for manufacturing to return to levels seen before the 2001 recession — and all those gains were wiped out in the current recession.
By contrast, military manufacturing is now 123 percent greater than it was in 2000 — it has more than doubled while the rest of the manufacturing sector has been shrinking…
It’s important to note the trajectory — the military economy is nearly three times as large, proportionally to the rest of the economy, as it was at the beginning of the Bush administration. And it is the only manufacturing sector showing any growth. Extrapolate that trend, and what do you get?
The change in leadership in Washington does not appear to be abating that trend…[121]
So most of the job creation has been by the public sector. But because the job creation has been financed with loans from China and private banks, trillions in unnecessary interest charges have been incurred by the U.S.
And this shows military versus non-military durable goods shipments:
us collapse 18 11 The Military Industrial Complex is Ruining the Economy
[Click here to view full image.]
So we’re running up our debt (which will eventually decrease economic growth), but the only jobs we’re creating are military and other public sector jobs.
PhD economist Dean Baker points out that America’s massive military spending on unnecessary and unpopular wars lowers economic growth and increasesunemployment:
Defense spending means that the government is pulling away resources from the uses determined by the market and instead using them to buy weapons and supplies and to pay for soldiers and other military personnel. In standard economic models, defense spending is a direct drain on the economy, reducing efficiency, slowing growth and costing jobs.
A few years ago, the Center for Economic and Policy Research commissioned Global Insight, one of the leading economic modeling firms, to project the impact of a sustained increase in defense spending equal to 1.0 percentage point of GDP. This was roughly equal to the cost of the Iraq War.
Global Insight’s model projected that after 20 years the economy would be about 0.6 percentage points smaller as a result of the additional defense spending. Slower growth would imply a loss of almost 700,000 jobs compared to a situation in which defense spending had not been increased. Construction and manufacturing were especially big job losers in the projections, losing 210,000 and 90,000 jobs, respectively.
The scenario we asked Global Insight [recognized as the most consistentlyaccurate forecasting company in the world] to model turned out to have vastly underestimated the increase in defense spending associated with current policy. In the most recent quarter, defense spending was equal to 5.6 percent of GDP. By comparison, before the September 11th attacks, the Congressional Budget Office projected that defense spending in 2009 would be equal to just 2.4 percent of GDP. Our post-September 11th build-up was equal to 3.2 percentage points of GDP compared to the pre-attack baseline. This means that the Global Insight projections of job loss are far too low…
The projected job loss from this increase in defense spending would be close to 2 million. In other words, the standard economic models that project job loss from efforts to stem global warming also project that the increase in defense spending since 2000 will cost the economy close to 2 million jobs in the long run.
The Political Economy Research Institute at the University of Massachusetts, Amherst has also shown that non-military spending creates more jobs than military spending.
So we’re running up our debt – which will eventually decrease economic growth – and creating many fewer jobs than if we spent the money on non-military purposes.

High Military Spending Drains Innovation, Investment and Manufacturing Strength from the Civilian Economy

Chalmers Johnson notes that high military spending diverts innovation and manufacturing capacity from the economy:
By the 1960s it was becoming apparent that turning over the nation’s largest manufacturing enterprises to the Department of Defense and producing goods without any investment or consumption value was starting to crowd out civilian economic activities. The historian Thomas E Woods Jr observes that, during the 1950s and 1960s, between one-third and two-thirds of all US research talent was siphoned off into the military sector. It is, of course, impossible to know what innovations never appeared as a result of this diversion of resources and brainpower into the service of the military, but it was during the 1960s that we first began to notice Japan was outpacing us in the design and quality of a range of consumer goods, including household electronics and automobiles.
***
Woods writes: “According to the US Department of Defense, during the four decades from 1947 through 1987 it used (in 1982 dollars) $7.62 trillion in capital resources. In 1985, the Department of Commerce estimated the value of the nation’s plant and equipment, and infrastructure, at just over _$7.29 trillion… The amount spent over that period could have doubled the American capital stock or modernized and replaced its existing stock”.
The fact that we did not modernise or replace our capital assets is one of the main reasons why, by the turn of the 21st century, our manufacturing base had all but evaporated. Machine tools, an industry on which Melman was an authority, are a particularly important symptom. In November 1968, a five-year inventory disclosed “that 64% of the metalworking machine tools used in US industry were 10 years old or older. The age of this industrial equipment (drills, lathes, etc.) marks the United States’ machine tool stock as the oldest among all major industrial nations, and it marks the continuation of a deterioration process that began with the end of the second world war. This deterioration at the base of the industrial system certifies to the continuous debilitating and depleting effect that the military use of capital and research and development talent has had on American industry.”
Economist Robert Higgs makes the same point about World War II:
Yes, officially measured GDP soared during the war. Examination of that increased output shows, however, that it consisted entirely of military goods and services. Real civilian consumption and private investment both fell after 1941, and they did not recover fully until 1946. The privately owned capital stock actually shrank during the war. Some prosperity. (My article in the peer-reviewed Journal of Economic History, March 1992, presents many of the relevant details.)
It is high time that we come to appreciate the distinction between the government spending, especially the war spending, that bulks up official GDP figures and the kinds of production that create genuine economic prosperity. As Ludwig von Mises wrote in the aftermath of World War I, “war prosperity is like the prosperity that an earthquake or a plague brings.”

Military Leaders Say Endless War Is Bad For the Economy

noted in 2010:
All of the spending on unnecessary wars adds up.
The U.S. is adding trillions to its debt burden to finance its multiple wars in Iraq, Afghanistan, Yemen, etc.
Two top American economists – Carmen Reinhart and Kenneth Rogoff – show that the more indebted a country is, with a government debt/GDP ratio of 0.9, and external debt/GDP of 0.6 being critical thresholds, the more GDP growth drops materially.
Specifically, Reinhart and Rogoff write:
The relationship between government debt and real GDP growth is weak for debt/GDP ratios below a threshold of 90 percent of GDP. Above 90 percent, median growth rates fall by one percent, and average growth falls considerably more. We find that the threshold for public debt is similar in advanced and emerging economies…
I also wrote in 2010:
It is ironic that America’s huge military spending is what made us an empire … but our huge military is what is bankrupting us … thus destroying our status as an empire.
As an economist told me:
War always causes recession. Well, if it is a very short war, then it may stimulate the economy in the short-run. But if there is not a quick victory and it drags on, then wars always put the nation waging war into a recession and hurt its economy.
(and remember Greenspan’s comment.)
But it’s not just civilians saying this.  The former head of the Joint Chiefs of Staff – Admiral Mullen –agrees:
The Pentagon needs to cut back on spending.
“We’re going to have to do that if it’s going to survive at all,” Mullen said, “and do it in a way that is predictable.”
Indeed, Mullen said:
For industry and adequate defense funding to survive … the two must work together. Otherwise, he added, “this wave of debt” will carry over from year to year, and eventually, the defense budget will be cut just to facilitate the debt.
Former Secretary of Defense Robert Gates agrees as well. As David Ignatius wrote in the Washington Post in 2010:
After a decade of war and financial crisis, America has run up debts that pose a national security problem, not just an economic one.
***
One of the strongest voices arguing for fiscal responsibility as a national security issue has been Defense Secretary Bob Gates. He gave a landmark speech in Kansas on May 8, invoking President Dwight Eisenhower’s warnings about the dangers of an imbalanced military-industrial state.
“Eisenhower was wary of seeing his beloved republic turn into a muscle-bound, garrison state — militarily strong, but economically stagnant and strategically insolvent,” Gates said. He warned that America was in a “parlous fiscal condition” and that the “gusher” of military spending that followed Sept. 11, 2001, must be capped. “We can’t have a strong military if we have a weak economy,” Gates told reporters who covered the Kansas speech.
On Thursday the defense secretary reiterated his pitch that Congress must stop shoveling money at the military, telling Pentagon reporters: “The defense budget process should no longer be characterized by ‘business as usual’ within this building — or outside of it.”
While some might want to start another war, America’s top military leaders and economists say that would be a very bad idea.
Indeed, military strategists have known for 2,500 years that prolonged wars are disastrous for the nation.

War Causes Inflation … Which Hurts Consumers

As I noted in 2010, war always causes inflation … which hurts consumers:
Liberal economist James Galbraith wrote in 2004:
Inflation applies the law of the jungle to war finance. Prices and profits rise, wages and their purchasing power fall. Thugs, profiteers and the well connected get rich. Working people and the poor make out as they can. Savings erode, through the unseen mechanism of the “inflation tax” — meaning that the government runs a big deficit in nominal terms, but a smaller one when inflation is factored in.
***
There is profiteering. Firms with monopoly power usually keep some in reserve. In wartime, if the climate is permissive, they bring it out and use it. Gas prices can go up when refining capacity becomes short — due partly to too many mergers. More generally, when sales to consumers are slow, businesses ought to cut prices — but many of them don’t. Instead, they raise prices to meet their income targets and hope that the market won’t collapse.
Libertarian Congressman Ron Paul agreed in 2007:
Congress and the Federal Reserve Bank have a cozy, unspoken arrangement that makes war easier to finance. Congress has an insatiable appetite for new spending, but raising taxes is politically unpopular. The Federal Reserve, however, is happy to accommodate deficit spending by creating new money through the Treasury Department. In exchange, Congress leaves the Fed alone to operate free of pesky oversight and free of political scrutiny. Monetary policy is utterly ignored in Washington, even though the Federal Reserve system is a creation of Congress.
The result of this arrangement is inflation. And inflation finances war.
Blanchard Economic Research pointed out in 2001:
War has a profound effect on the economy, our government and its fiscal and monetary policies. These effects have consistently led to high inflation.
***
David Hackett Fischer is a Professor of History and Economic History at Brandeis. [H]is book, The Great Wave, Price Revolutions and the Rhythm of History … finds that … periods of high inflation are caused by, and cause, a breakdown in order and a loss of faith in political institutions. He also finds that war is a triggering influence on inflation, political disorder, social conflict and economic disruption.
***
Other economists agree with Professor Fischer’s link between inflation and war.
James Grant, the respected editor of Grant’s Interest Rate Observer, supplies us with the most timely perspective on the effect of war on inflation in the September 14 issue of his newsletter:
“War is inflationary. It is always wasteful no matter how just the cause. It is cost without income, destruction financed (more often than not) by credit creation. It is the essence of inflation.”
Libertarian economics writer Lew Rockwell noted in 2008:
You can line up 100 professional war historians and political scientists to talk about the 20th century, and not one is likely to mention the role of the Fed in funding US militarism. And yet it is true: the Fed is the institution that has created the money to fund the wars. In this role, it has solved a major problem that the state has confronted for all of human history. A state without money or a state that must tax its citizens to raise money for its wars is necessarily limited in its imperial ambitions. Keep in mind that this is only a problem for the state. It is not a problem for the people. The inability of the state to fund its unlimited ambitions is worth more for the people than every kind of legal check and balance. It is more valuable than all the constitutions every devised.
***
Reflecting on the calamity of this war, Ludwig von Mises wrote in 1919
One can say without exaggeration that inflation is an indispensable means of militarism. Without it, the repercussions of war on welfare become obvious much more quickly and penetratingly; war weariness would set in much earlier.***
In the entire run-up to war, George Bush just assumed as a matter of policy that it was his decision alone whether to invade Iraq. The objections by Ron Paul and some other members of Congress and vast numbers of the American population were reduced to little more than white noise in the background. Imagine if he had to raise the money for the war through taxes. It never would have happened. But he didn’t have to. He knew the money would be there. So despite a $200 billion deficit, a $9 trillion debt, $5 trillion in outstanding debt instruments held by the public, a federal budget of $3 trillion, and falling tax receipts in 2001, Bush contemplated a war that has cost $525 billion dollars — or $4,681 per household. Imagine if he had gone to the American people to request that. What would have happened? I think we know the answer to that question. And those are government figures; the actual cost of this war will be far higher — perhaps $20,000 per household.
***
If the state has the power and is asked to choose between doing good and waging war, what will it choose? Certainly in the American context, the choice has always been for war.
And progressive economics writer Chris Martenson explains as part of his “Crash Course” on economics:
If we look at the entire sweep of history, we can make an utterly obvious claim: All wars are inflationary. Period. No exceptions.
***
So if anybody tries to tell you that you haven’t sacrificed for the war, let them know you sacrificed a large portion of your savings and your paycheck to the effort, thank you very much.
The bottom line is that war always causes inflation, at least when it is funded through money-printing instead of a pay-as-you-go system of taxes and/or bonds. It might be great for a handful of defense contractors, but war is bad for Main Street, stealing wealth from people by making their dollars worth less.

War Increases Terrorism … And Terrorism Hurts the Economy

Security experts – conservative hawks and liberal doves alike – agree that waging war in the Middle Eastweakens national security and increases terrorism. See thisthisthisthisthisthis and this.
Terrorism – in turn – terrorism is bad for the economy. Specifically, a study by Harvard and the National Bureau of Economic Research (NBER) points out:
From an economic standpoint, terrorism has been described to have four main effects (see, e.g., US Congress, Joint Economic Committee, 2002). First, the capital stock (human and physical) of a country is reduced as a result of terrorist attacks. Second, the terrorist threat induces higher levels of uncertainty. Third, terrorism promotes increases in counter-terrorism expenditures, drawing resources from productive sectors for use in security. Fourth, terrorism is known to affect negatively specific industries such as tourism.
The Harvard/NBER concludes:
In accordance with the predictions of the model, higher levels of terrorist risks are associated with lower levels of net foreign direct investment positions, even after controlling for other types of country risks. On average, a standard deviation increase in the terrorist risk is associated with a fall in the net foreign direct investment position of about 5 percent of GDP.
So the more unnecessary wars American launches and the more innocent civilians we kill, the less foreign investment in America, the more destruction to our capital stock, the higher the level of uncertainty, the more counter-terrorism expenditures and the less expenditures in more productive sectors, and the greater the hit to tourism and some other industries.
Terrorism has contributed to a decline in the global economy (for example, European Commission, 2001).
So military adventurism increases terrorism which hurts the world economy. And see this.

The Proof Is In the Pudding

noted last year:
This is a no-brainer, if you think about it.
We’ve been in Afghanistan for almost twice as long as World War II. We’ve been in Iraq for years longer than WWII. We’ve been involved in 7 or 8 wars in the last decade. And yet still in a depression. (And see this).
If wars really helped the economy, don’t you think things would have improved by now?
Indeed, the Iraq war alone could end up costing more than World War II. And given the other wars we’ve been involved in this decade, I believe that the total price tag for the so-called “War on Terror” will definitely support that of the “Greatest War”.
"Postscript on Iran:  Well-known economist Nouriel Roubini says that attacking Iran would lead to global recession. The IMF says that Iran cutting off oil supplies could raise crude prices 30%."
Credit: Washingtonblog posted last feb 24, 2012